Use this worksheet to demonstrate how to determine a percentage with a visual model.
Percent of a Shaded Region Worksheet
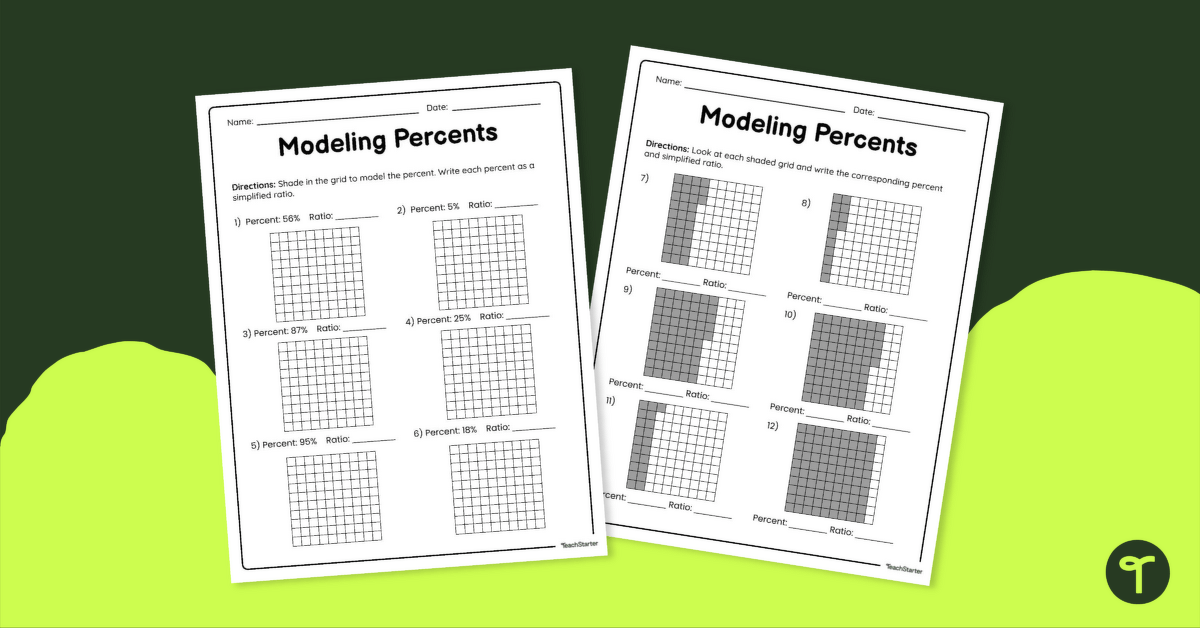
Are your students learning to determine what percent is represented by the shaded area? Maybe they are practicing how to shade in a grid to show a certain percentage. If so, Teach Starter has a math worksheet ready for you to use with your students during your percentages unit.
With this worksheet, students will practice shading in 10×10 grids to represent a variety of percentages. Additionally, students must look at shaded grids, determine the percentage, and write each as a ratio.
An answer key is included with your download to make grading fast and easy!
🖨️ Easily Download & Print
Use the dropdown icon on the Download button to choose between the PDF or editable Google Slides version of this resource.
Because this resource includes an answer sheet, we recommend you print one copy of the entire file. Then, make photocopies of the blank worksheet for students to complete.
To save paper, we suggest printing this 2-page worksheet double-sided.
Turn this teaching resource into a sustainable activity by printing on cardstock and slipping it into a dry-erase sleeve. Students can record their answers with a whiteboard marker, then erase and reuse them.
This resource was created by Cassandra Friesen, a teacher in Colorado and Teach Starter Collaborator.
Don’t stop there! We’ve got more activities to shorten your lesson planning time:
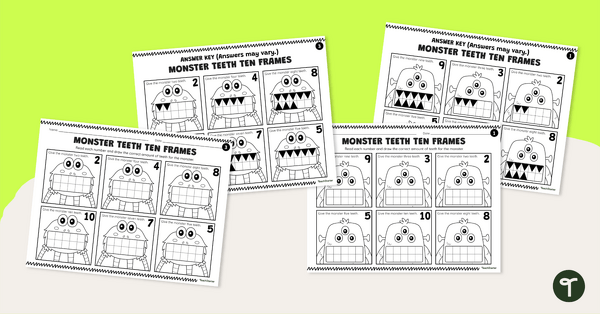
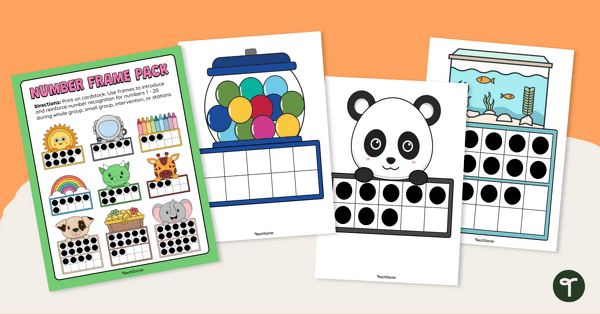
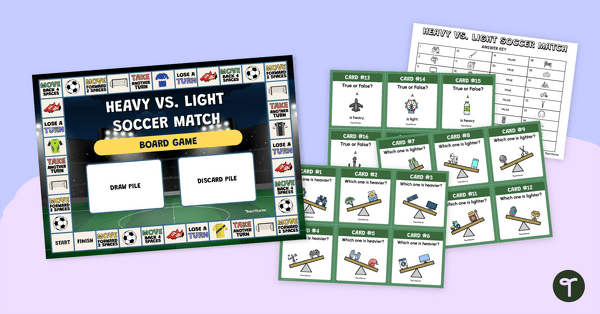
[resource:4862331] [resource:4861722] [resource:4847515]



0 Comments
Write a review to help other teachers and parents like yourself. If you'd like to request a change to this resource, or report an error, select the corresponding tab above.