Math 2.10
Data analysis. The student applies mathematical process standards to organize data to make it useful for interpreting information and solving problems. The student is expected to:
- (1) explain that the length of a bar in a bar
graph or the number of pictures in a pictograph represents the number of data points for a given
category;
- (A) organize a collection of data with up to four categories using pictographs and bar graphs with intervals of one or more;
- (B) write and solve one-step word problems involving addition or subtraction using data represented within pictographs and bar graphs with intervals of one; and
- (C) draw conclusions and make predictions from information in a graph.
- Plus Plan
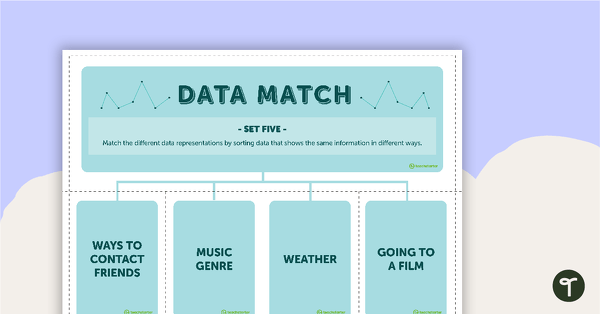
Data Match-Up Cards (Set 5)
A match-up activity for students to use when exploring data.
- Plus Plan
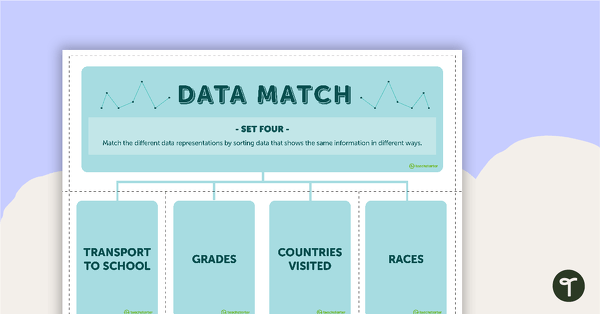
Data Match-Up Cards (Set 4)
A match-up activity for students to use when exploring data.
- Plus Plan
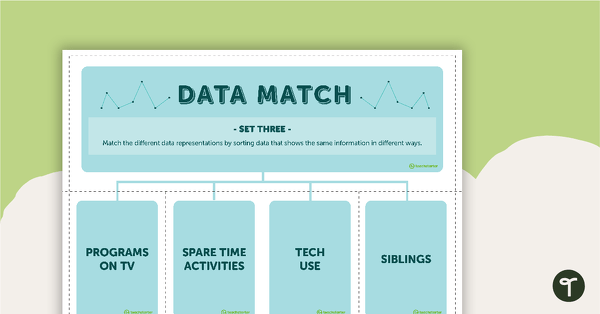
Data Match-Up Cards (Set 3)
A match-up activity for students to use when exploring data.
- Plus Plan
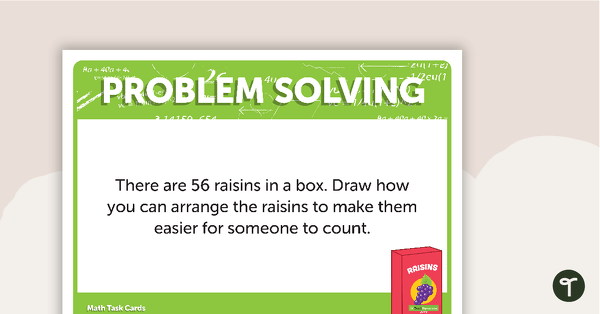
Open-ended Math Problem Solving - Grades 1, 2, and 3 (Task Card Version)
A set of 20 open-ended problem solving task cards covering a range of mathematical concepts.
- Plus Plan
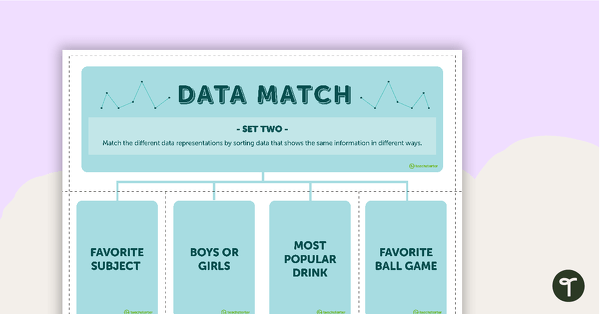
Data Match Game Cards (Set 2)
A match up game for students to use when exploring data.
- Plus Plan
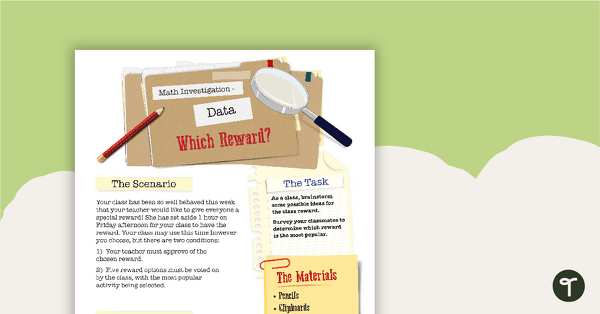
Data Math Investigation - Which Reward?
A mathematics investigation involving data collection and representation, embedded in a real-world context.
- Plus Plan
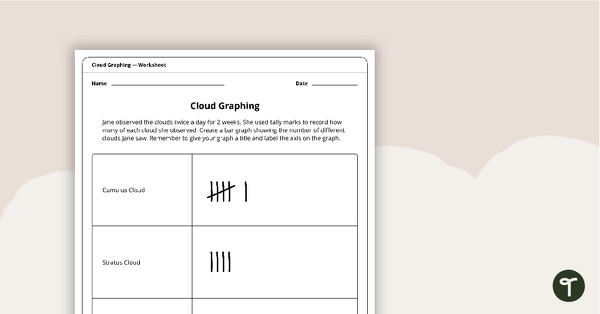
Cloud Graphing Activity
A worksheet to use when graphing cloud observations.
- Plus Plan
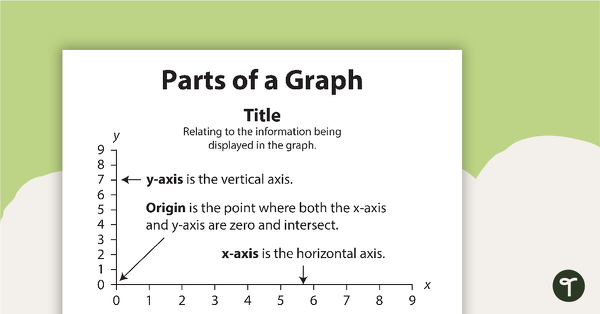
Parts of a Graph (Black and White Version)
A poster showing the different parts of a graph.
- Plus Plan
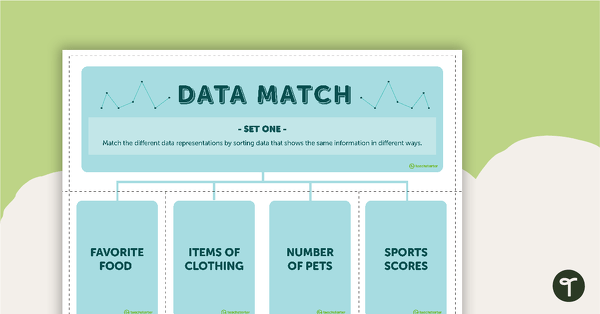
Data Match Game Cards (Set 1)
A match-up game for students to use when exploring data.
- Plus Plan
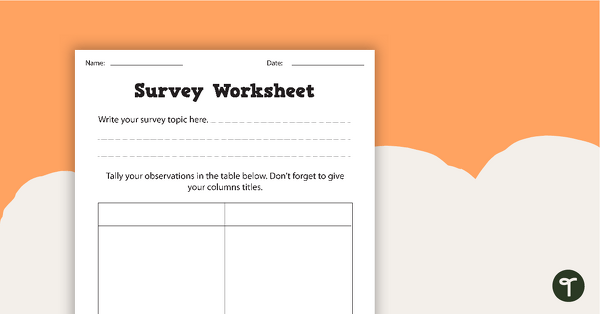
Data Collection - Worksheets
A set of worksheets for students to plan survey parameters and tally data.
- Plus Plan

Data Match-Up Cards Resource Pack
A match-up activity resource pack for students to use when exploring data.